
Do you think data analysis is extraordinarily complex? Is significant training and experience the only way to understand vast amounts of data? Whilst it was once the case, now with the right software, that is just not true. gluoNNet develops data analysis and data-visualisation solutions that unlock your data’s hidden value. Our sophisticated algorithms do the heavy lifting for you, and then our visualisations provide the clarity to make informed decisions.
Our solutions provide you with a concise summary of all your data, laying bare all the intricacies and nuances by highlighting all the important relationships, bottlenecks, and other strategic insights. With this ‘x-ray vision’ for data, you can enhance your decision-making process, making your organisation more efficient and effective.
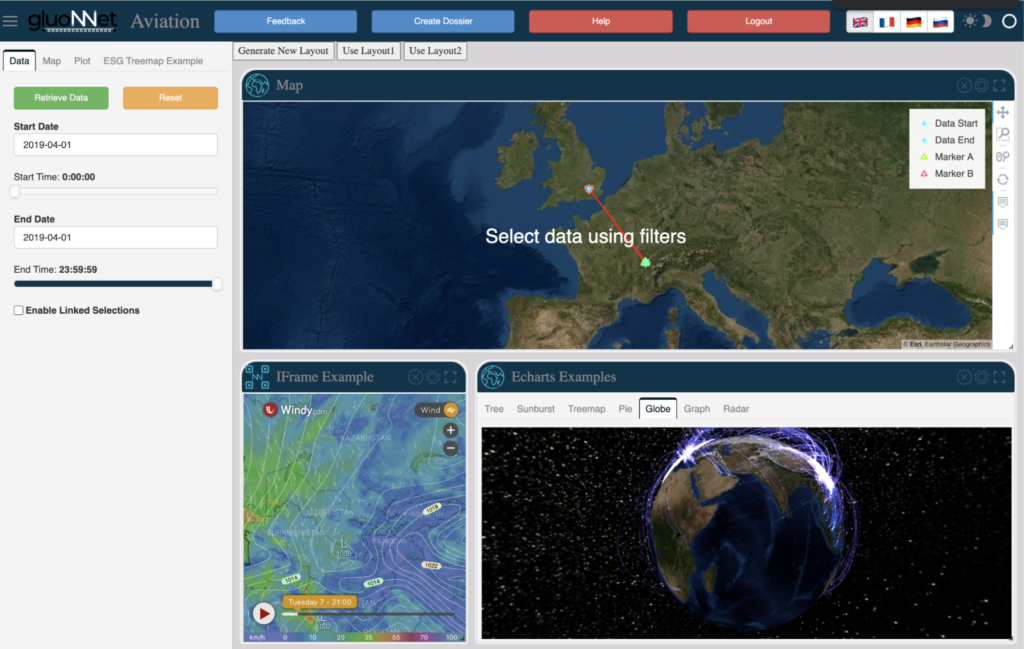
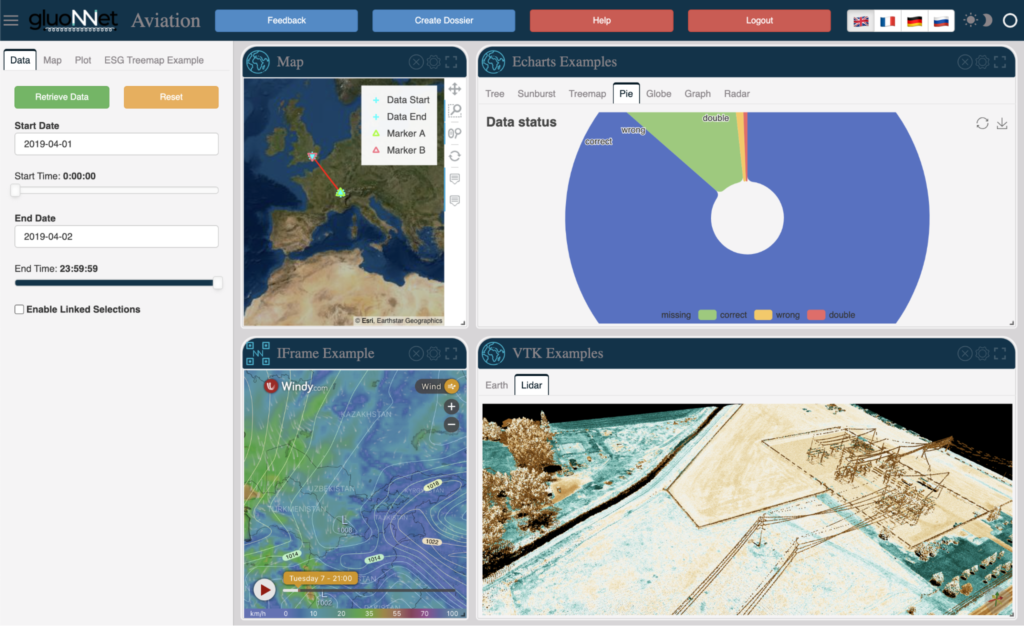
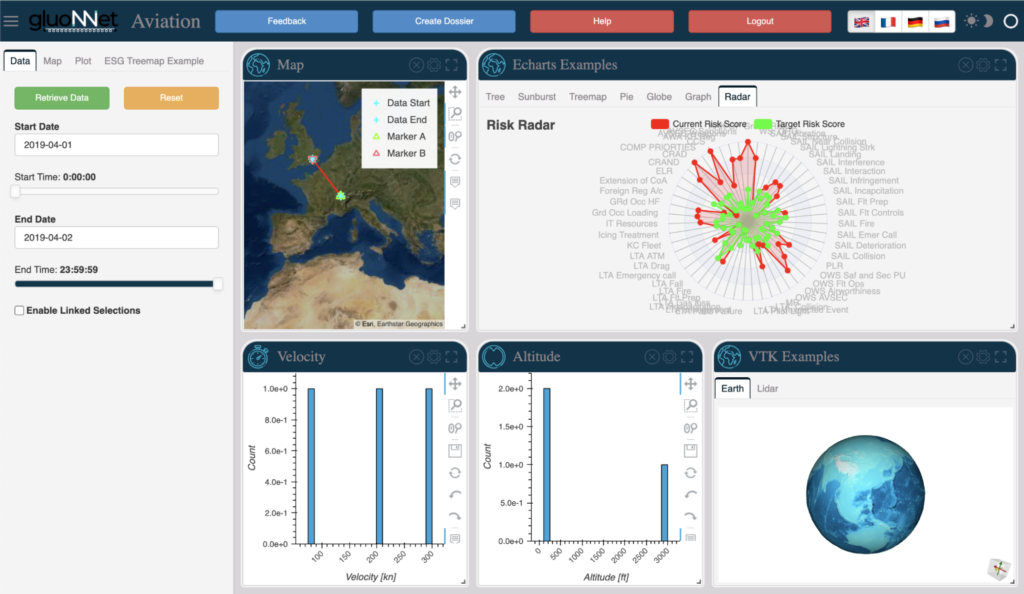
Our modular UI (user interface), is simple to tailor to your needs, allowing an intuitive and clear overview of your organisation with the flexibility to put any aspect of the data under the microscope. The UI displays this data in the most user-friendly way, whether that is with a diagram, map, cluster/galaxy, gauge, bespoke method, or even a simple table — ensuring you can always see your data clearly. With a few clicks, the user can easily filter from large amounts of data to just show anomalies. Workforce optimisation is easy, with flexible views allowing for individual or role-based customisation focusing on relevant data and also restricting access to sensitive data to only those who require it. Each user can easily drag and rearrange the visualisations in a view, to produce a layout that suits them, saving it for later use and sharing with other users.
All gluoNNet UI solutions can be customised in a simple and dynamic way.
Our algorithms allow real-time or near real-time processing, no matter if the data is coming from scientific, industrial, financial, infrastructure, or other contexts. Our software can combine many input sources, and is compatible with the cloud, on-premise and disconnected networks. It also tracks and highlights any changes of interest, subject to your criteria, by providing custom alerts. This allows you to stop labour-intensive monitoring and relax, knowing the software will highlight important information. If our algorithms identify urgent alerts, you can receive an immediate notification, allowing you to tackle critical issues without delay. Our product allows for automated or user-controlled dossier and report creation to allow specific alerts or custom analysis to be circulated to a wider audience.
We have applied this innovative approach on aviation data, resulting in a first-of-its-kind digital regulation system for the aviation industry. The aim of this innovative system is to allow better management of aviation-related issues that require regulatory oversight, quickly verifying information, speeding up approval procedures, and stopping actions that are illegal or deceptive.
Click on the images in the gallery to see them in full size.
Another use case we are working on is to better identify and maximise materiality when applied to ESG (Environmental, Social, and Governance) metrics. The user can run diagnostics on current internal processes, and identify gaps or missing areas, articulated and measured within a live dynamic decision-making environment. Regularly ingesting data and processing real-time financial information to continuously update a materiality framework. This allows the user to look at trends over time, discerning what is driving the market, and eventually positioning the company as a global citizen within the ESG future state.
For more information on our data analysis and data visualisation solutions, please contact Michael Denyer or info@gluonnet.com.